
REDCapExploreR provides exploratory tools for REDCap projects accessed through the REDCap API. Use it to inspect project structure, review form completion, and identify general data quality findings without modifying the REDCap project.
Installation
Install the development version from GitHub and load the package:
devtools::install_github("CHOP-CGTInformatics/REDCapExploreR")
library(REDCapExploreR)
REDCap API credentials
Functions that retrieve a REDCap project need an API endpoint and a project token with appropriate API permissions. Store credentials outside version-controlled code, such as in environment variables:
redcap_uri <- Sys.getenv("REDCAP_URI")
token <- Sys.getenv("REDCAP_TOKEN")
The examples below assume redcap_uri and
token are set. The package also includes synthetic objects
for credential-free exploration.
Choose a workflow
The primary workflows are independent. Start with the function that matches your review goal.
| Goal | Start with |
|---|---|
| Understand project fields and structure | build_codebook() |
| Review form completion | build_record_status_data() |
| Review data quality findings | build_quality_report() |
| Analyze the underlying API tables directly | pull_redcap_project() |
Codebook
build_codebook() returns a structured view of project
fields, choices, forms, events, repeating configuration, and
project-level metadata.
codebook <- build_codebook(
  redcap_uri = redcap_uri,
  token = token
)

codebook
codebook$fields
Use mock_codebook to inspect the same output structure
without API credentials.
mock_codebook
#> <REDCap codebook>
#> Project: Mock REDCap Database
#> Forms: 3
#> Fields: 11
#> Events: 2
#> Repeating enabled: TRUE
head(mock_codebook$fields)
#> # A tibble: 6 × 19
#>   field_order form_order form_name  form_label field_name field_label field_type
#>         <int>      <int> <chr>      <chr>      <chr>      <chr>       <chr>
#> 1           1          1 demograph… Demograph… record_id  Record ID   text
#> 2           2          1 demograph… Demograph… age        Age at enr… text
#> 3           3          1 demograph… Demograph… enrollmen… Enrollment… text
#> 4           4          1 demograph… Demograph… sex        Sex         radio
#> 5           5          2 follow_up  Follow-up  visit_date Visit date  text
#> 6           6          2 follow_up  Follow-up  response_… Response s… text
#> # ℹ 12 more variables: descriptive_field <lgl>, required_field <lgl>,
#> #   identifier <lgl>, choice_count <int>, choices <chr>, validation <chr>,
#> #   branching_logic <chr>, event_count <int>, event_names <chr>,
#> #   repeating_status <chr>, field_note <chr>, matrix_group_name <chr>
view_codebook() presents each available section as an
interactive HTML table:
view_codebook(codebook)See the build_codebook()
reference for output details and the available viewing options.
To save a codebook output to HTML, simply use:
save_codebook(codebook, file = "path.html")Record status dashboard
build_record_status_data() summarizes REDCap form
completion by record. plot_record_status() converts that
table into a ggplot heat map similar to the REDCap Record Status
Dashboard.
status_data <- build_record_status_data(
  redcap_uri = redcap_uri,
  token = token
)

plot_record_status(status_data)
The synthetic mock_record_status_data can be plotted
directly:
plot_record_status(mock_record_status_data)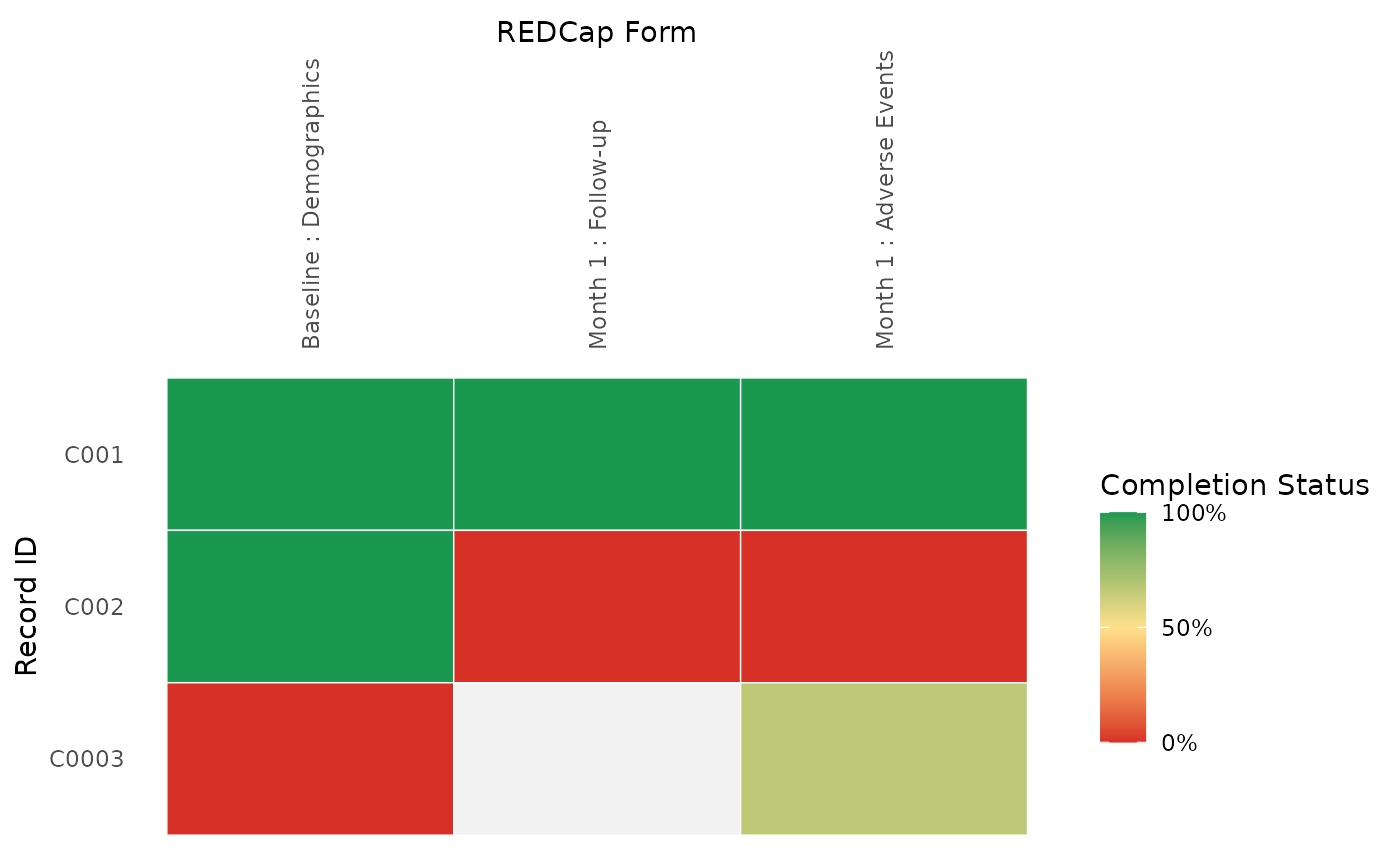
See the plot_record_status()
reference for compact mode and display customization.
Quality report
build_quality_report() retrieves records and project
structure, runs general data quality checks, and returns findings,
summaries, and standardized metadata.
report <- build_quality_report(
  redcap_uri = redcap_uri,
  token = token
)

report
report$summaries$project
report$findings
Use mock_quality_report to explore the report structure
and example findings:
mock_quality_report
#> <REDCap quality report>
#> Records: 3
#> Fields: 11
#> Findings: 7

mock_quality_report$findings |>
  dplyr::select(
    finding_id,
    check,
    issue,
    severity,
    record_id,
    field_name
  )
#> # A tibble: 7 × 6
#>   finding_id check       issue                    severity record_id field_name
#>        <int> <chr>       <chr>                    <chr>    <chr>     <chr>
#> 1          1 metadata    high_risk_free_text      info     NA        visit_notes
#> 2          2 outliers    outside_validation_range warning  C002      age
#> 3          3 outliers    future_date              info     C002      enrollment…
#> 4          4 operational incomplete_form_status   info     C0003     demographi…
#> 5          5 operational incomplete_form_status   info     C002      follow_up_…
#> 6          6 operational incomplete_form_status   info     C002      adverse_ev…
#> 7          7 operational incomplete_form_status   info     C0003     adverse_ev…
See the quality report article for check definitions, output structure, interpretation guidance, and core assumptions.
Advanced project data access
pull_redcap_project() retrieves the record and
structural metadata tables used by the quality-report workflow. Use it
when a custom analysis needs the underlying API responses directly.
project <- pull_redcap_project(
  redcap_uri = redcap_uri,
  token = token
)

names(project)
mock_redcap_project has the same top-level
structure:
names(mock_redcap_project)
#> [1] "data"                  "metadata"              "events"
#> [4] "event_instruments"     "instruments"           "repeating_instruments"
#> [7] "project_info"
Next steps
- Use the quality report article for a deeper review of quality checks and report interpretation.
- Browse the function reference for complete arguments and return values.
- Explore
mock_redcap_project,mock_record_status_data,mock_codebook, andmock_quality_reportwhen REDCap credentials are not available.