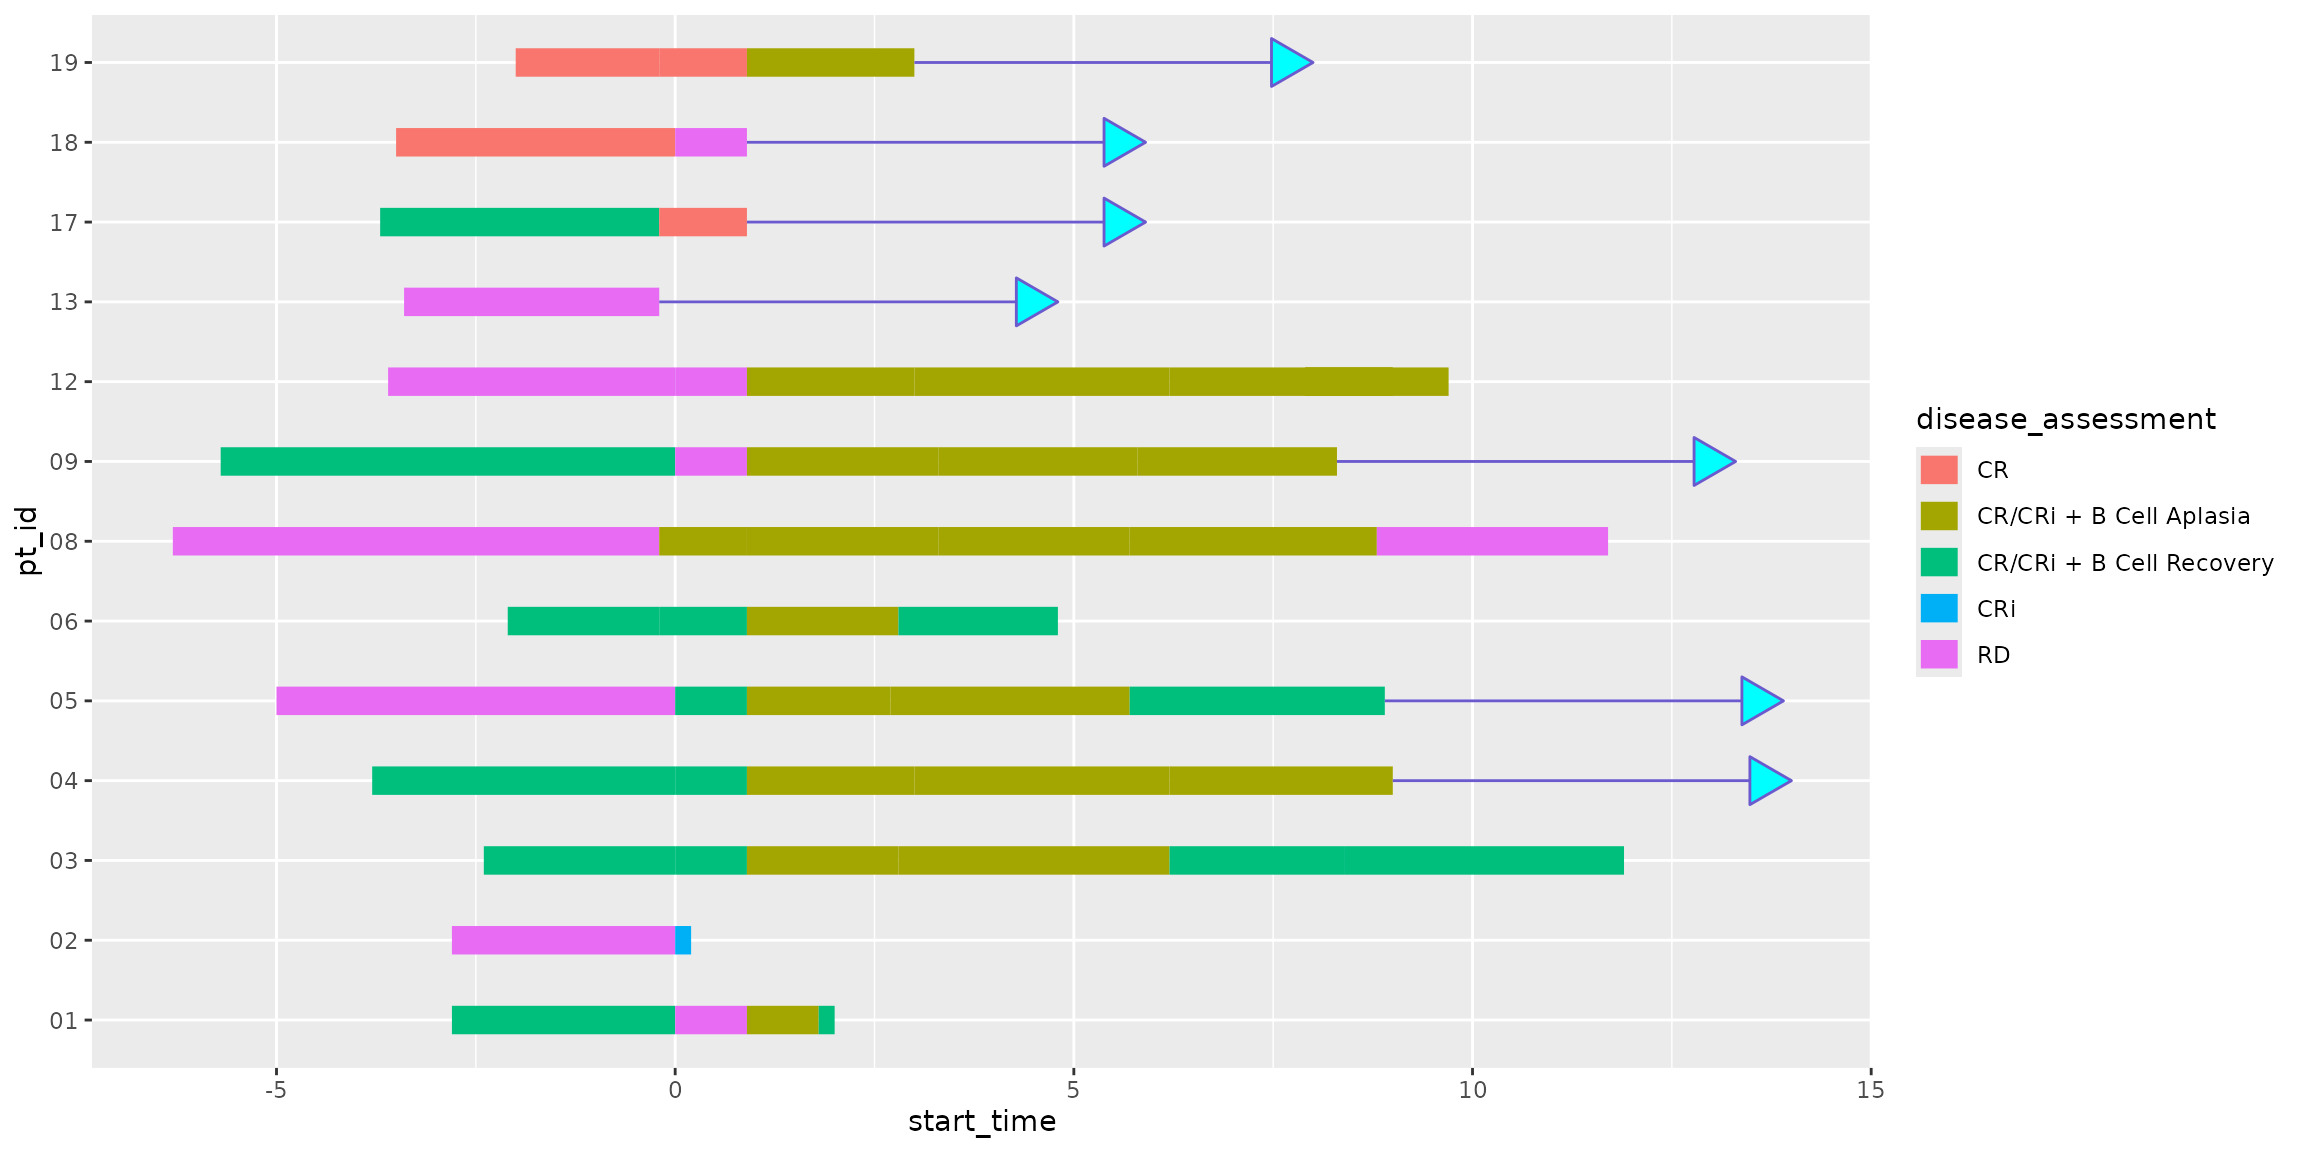
It can be useful to visually indicate the continuation of specific records in a swimmer plot. Optionally adding arrows to the tail ends of swimmer plot lanes in ggswim can help communicate subject survival status, such as whether or not a subject is still on a given study.
To facilitate the addition of arrows, we provide the
add_arrows() function as a way to tack on these
continuation indicators to your swimmer plot lanes. Behind the scenes,
the inclusion of arrows is facilitated by a call to
ggplot2::geom_segment() and creates a new ggplot2 layer
with a ggswim_arrows flag. add_arrows() sets
the segment length to 0, so that assigned arrows are always placed on
the right side of indicated subjects. add_arrows() gives
users have full control over arrow neck and head length, along with
options for color, fill, and type (refer to ?add_arrows for
detailed information).
Adding arrows using add_arrows()
To demonstrate how you might add arrows onto the
patient_data dataset, let’s take a sample subset of
patient_data that would help us make use of
add_arrows():
arrow_data |>
  rmarkdown::paged_table()
This should look familiar, a pared-down dataset with a
status column that we’ll use to flag which lanes of our
swimmer plot should have arrows. Now let’s use add_arrows()
in combination with ggswim() to make a swimmer plot:
patient_data |>
  ggswim(
    mapping = aes(
      x = start_time, xend = end_time, y = pt_id,
      color = disease_assessment
    ),
    linewidth = 5
  ) +
  add_arrows(
    data = arrow_data,
    mapping = aes(xend = end_time, y = pt_id),
    arrow = status,
    arrow_neck_length = 5,
    arrow_colour = "slateblue",
    arrow_fill = "cyan"
  )