This function applies custom styling to various elements of ggplot2 plots, including title, subtitle, caption, axis text, axis titles, and legend text and legend titles.
Usage
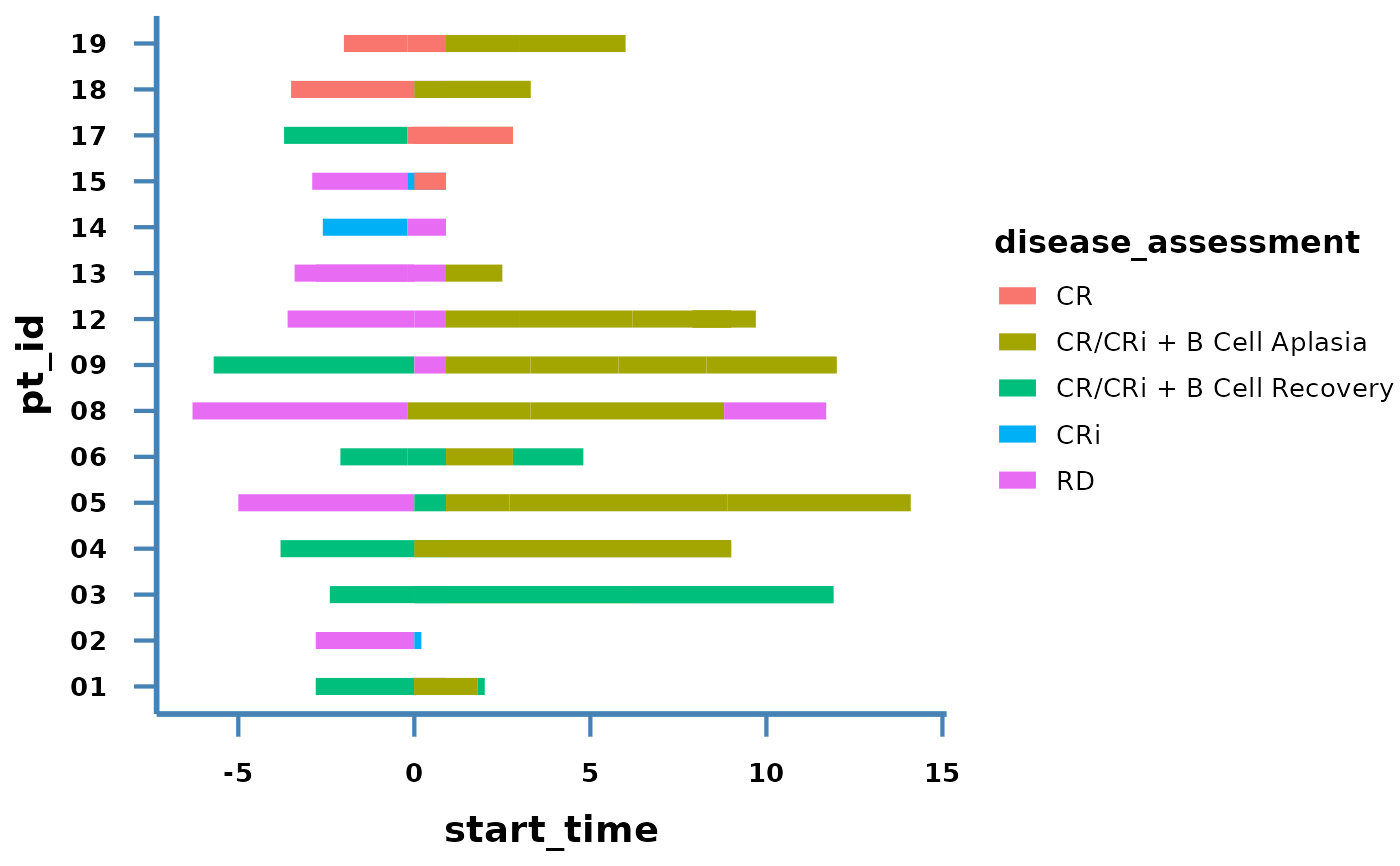
theme_ggswim(base_size = 12, base_family = "")
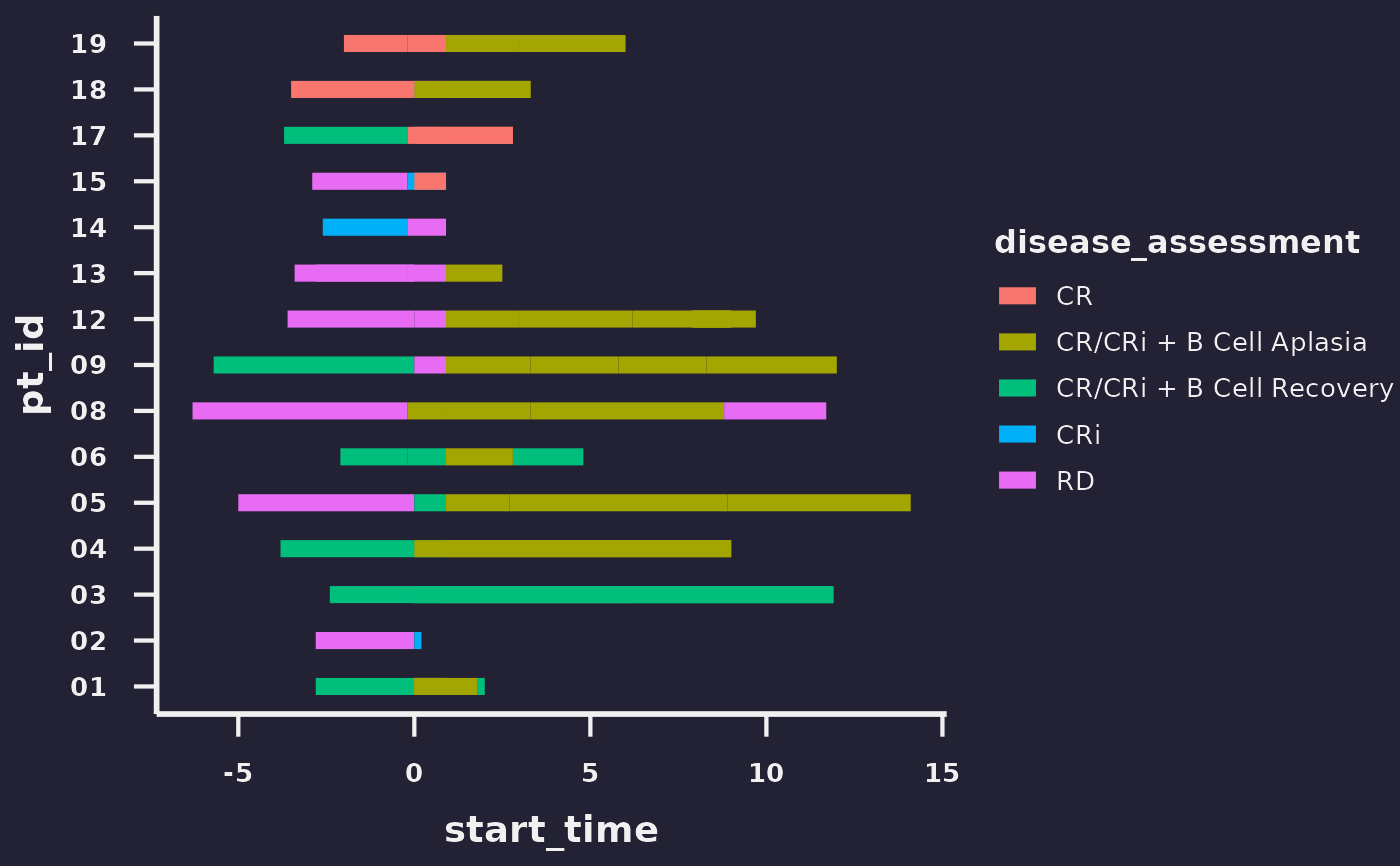
theme_ggswim_dark(base_size = 12, base_family = "")Details
This function builds upon the theme_minimal() function in ggplot2 but overrides
specific theme elements to provide a customized look and feel for plots.
Examples
p <- ggplot2::ggplot() +
  geom_swim_lane(
    data = patient_data,
    mapping = aes(
      x = start_time,
      xend = end_time,
      y = pt_id,
      colour = disease_assessment
    ),
    linewidth = 3
  )

p +
  theme_ggswim()


p +
  theme_ggswim_dark()
p +
theme_ggswim_dark()